LiDAR & how it can inform forestry practices
July 9, 2019 11:09 am 2 Comments
Welcome back, dear reader. In this instalment, I’m going to share my understanding of LiDAR technology, and further delve into how it can inform forestry practices.
What is LiDAR technology?
LiDAR, or Light Detection And Ranging, is a remote sensing method that uses pulses of laser light to measure distances to the earth’s surface, or, features on the earth’s surface.
(Did you know? The word “laser” is actually an acronym for “Light Amplification by Stimulated Emission of Radiation”.)
The laser used in LiDAR systems uses wavelengths that fall in the green and near-infrared regions of the electromagnetic spectrum. These wavelengths strongly reflect off of vegetation.
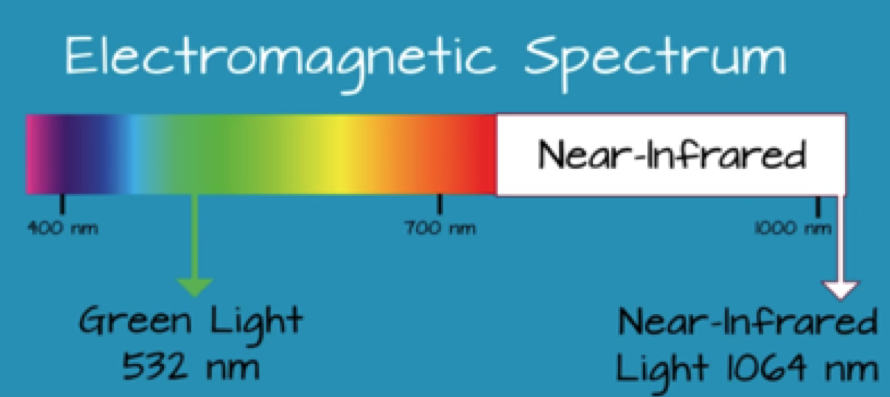
Where LiDAR wavelengths fall within the visible and near-infrared regions of the electromagnetic spectrum. [NEON, 2014.]
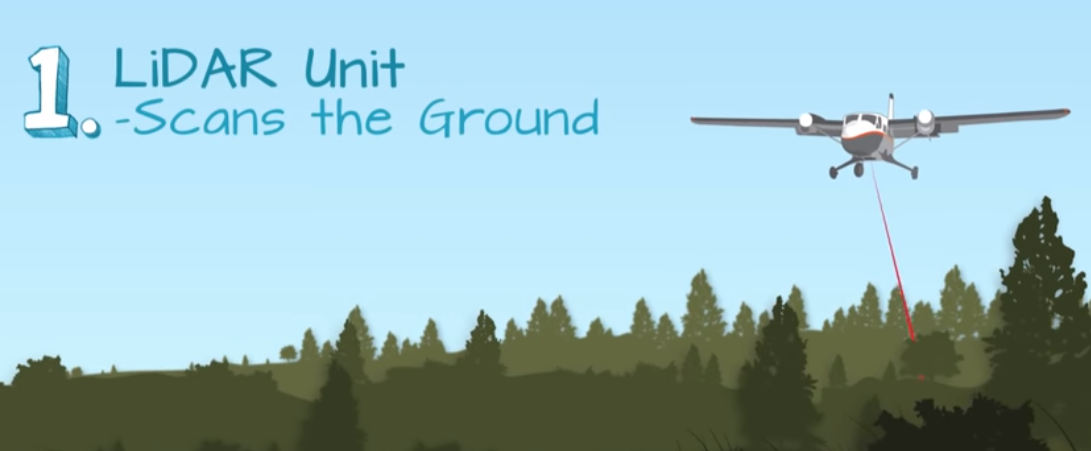
The LiDAR unit emits laser pulses and records the returning energy from the earth’s surface.
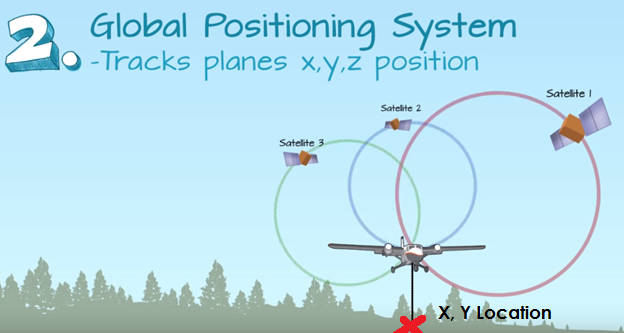
The Global Positioning System (GPS) tracks the altitude and position of the airplane. It allows us to figure out where the LiDAR energy reflections are on the ground.
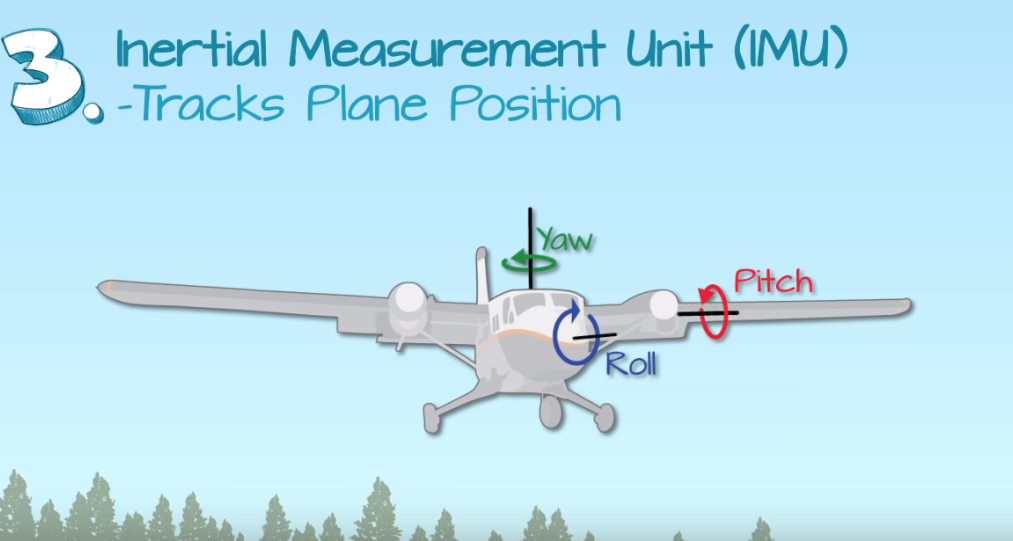
The Inertial Measurement Unit records the tilt of the airplane as it flies through the sky.

A computer onboard the airplane records the elevation data collected as LiDAR system scans the earth’s surface.
How do laser beam measurements become usable data?
The laser in the LiDAR system scans the earth, emitting light energy towards the ground. This is what makes LiDAR different from other remote sensing methods (such as the satellites that collect imagery for Google Earth). Satellites generally collect measurements of the passive, solar energy reflected off of the earth’s surface. LiDAR is a method of active remote-sensing because measurements are collected of the energy that is actively emitted from the laser and then reflected off of the earth’s surface.
So! Pulses of light energy are emitted from the LiDAR system and when they reflect off of the earth’s surface, the energy is returned to the LiDAR system and recorded. The distance between the LiDAR system and the earth’s surface is called the range. It is measured by recording the time it takes for the light energy to hit the ground and return back to the LiDAR system. The speed of that light is then used to calculate the distance between the top of the object reflected and the plane.
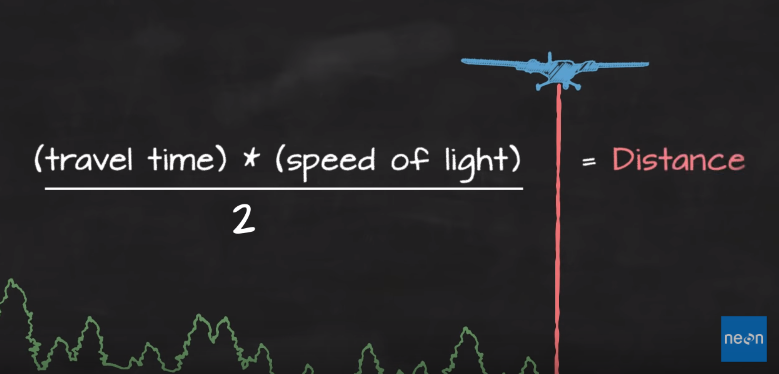
You divide by two because the light energy travelled twice – from the plane to the surface, and from the surface back up to the plane.
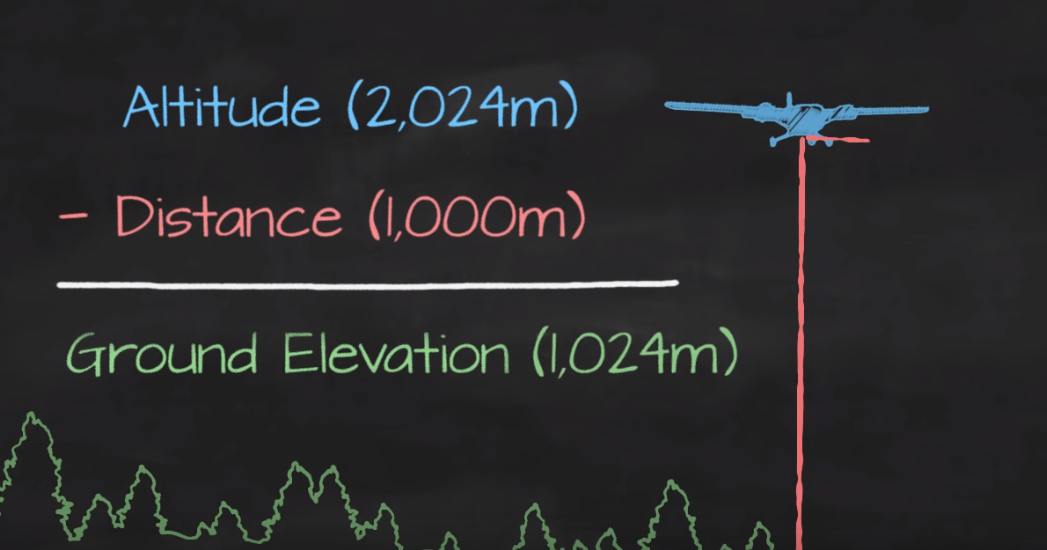
To figure out ground elevation, distance from the ground is subtracted from the plane altitude measured by the GPS receiver.
There are a few more calculations that must be made to accurately measure elevation. The first measurement is the tilt of the plane, which is accounted for by the Inertial Measurement Unit. The second is the angle of the pulses sent from the LiDAR system. Most pulses leave the LiDAR system at an angle because the laser scans the ground side to side so as to cover a larger area on the ground while flying. As such, pulse angle also needs to be accounted for when measuring elevation.
What does raw LiDAR data look like?
You may be questioning – what becomes of that reflected laser energy? Generally, LiDAR data is represented through a point cloud, as shown in the visualization below.
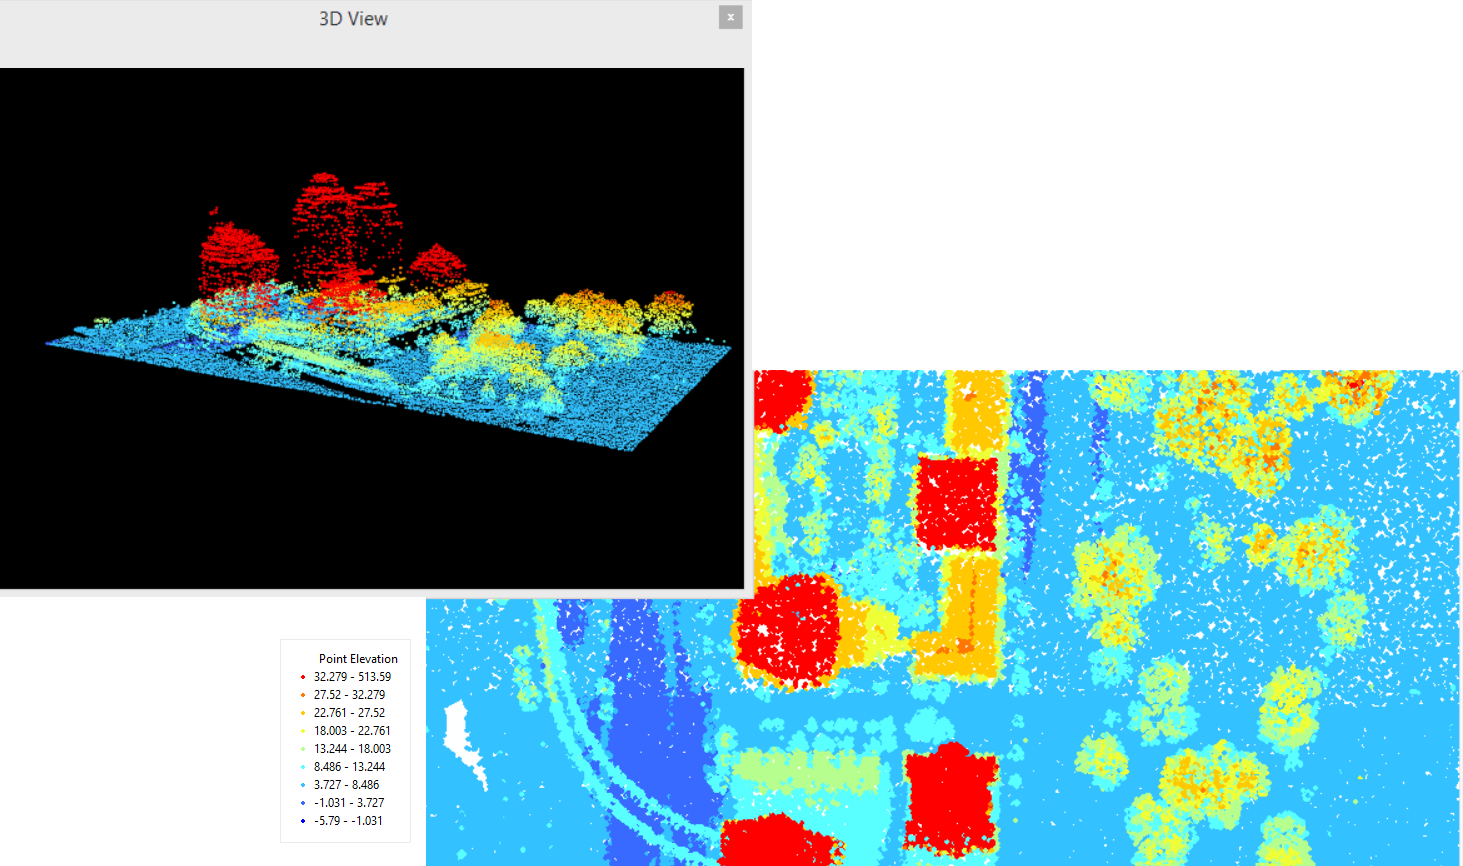
[City of Vancouver, 2013.]
What can you identify in the three-dimensional view? The tall buildings (red) and trees (green-yellow-orange spheres) stand out the most to me.
How does LiDAR data inform the forestry sector?
As there are often gaps on the surface of features on the earth’s surface, multiple energy returns can occur. For example: when acquiring LiDAR data in a forest, the laser will slip through branches and leaves. Thereby, multiple returns can be recorded – the forest floor, understory vegetation, and sometimes several levels of the tree canopy.
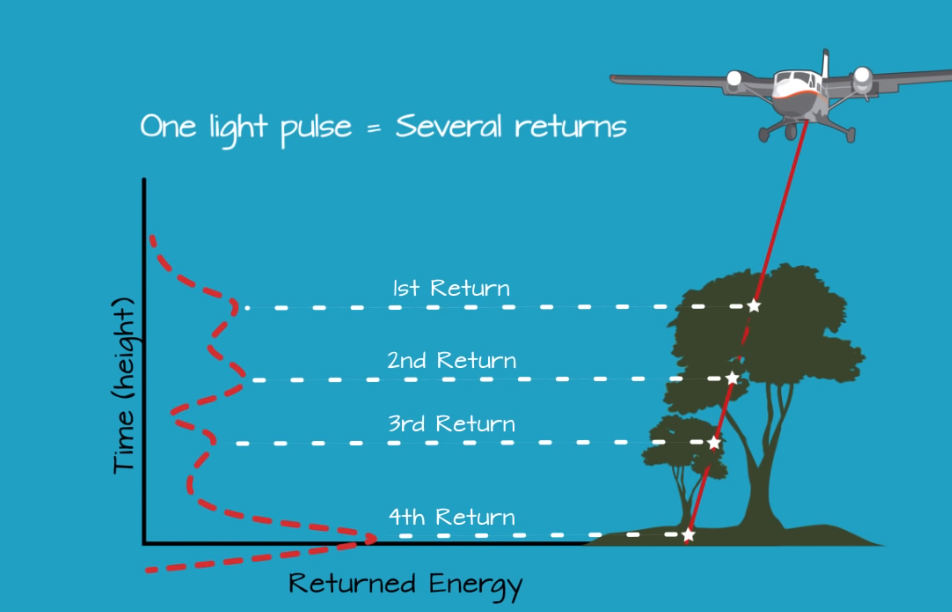
An example of multiple LiDAR returns. [NEON, 2014.]
There are so many examples of LiDAR-derived products. In my opinion, visualizing tree heights with LiDAR data actually looks pretty neat. A Canopy Height Model (CHM) is a good example of such a visualization. CHMs can help inform where forestry companies may want to harvest trees.
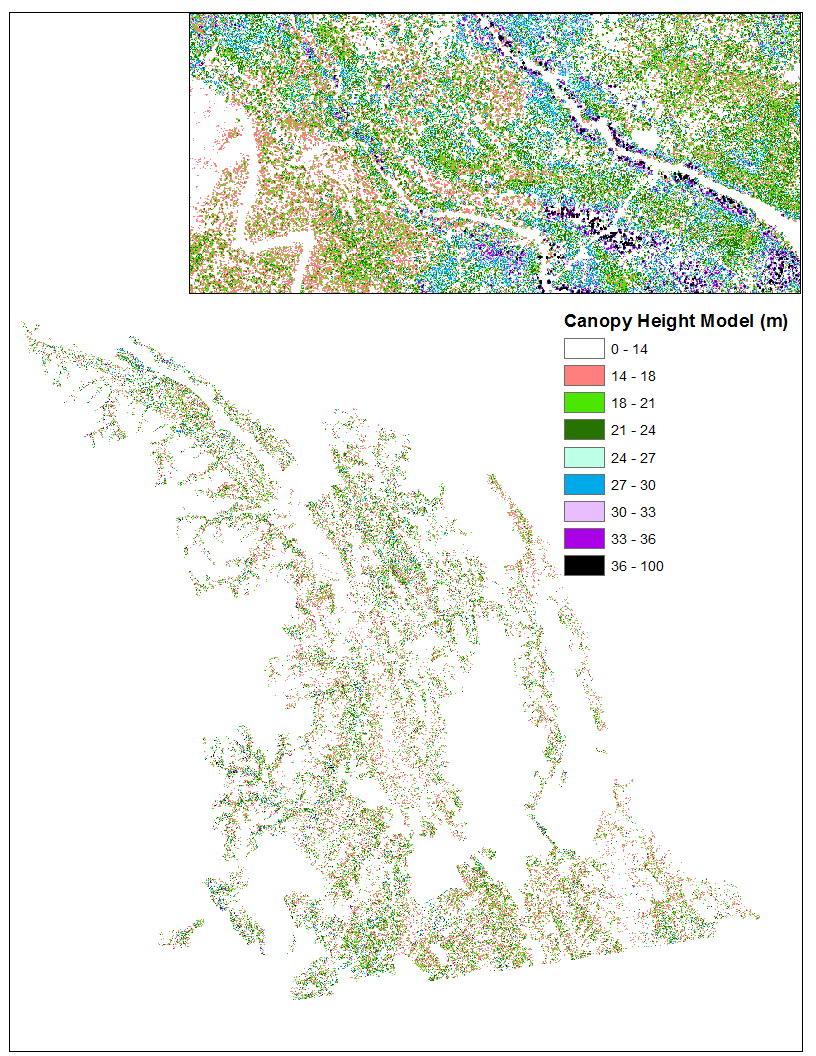
Each point in this CHM has an elevational value that represents the height of the tree located there.[Canfor, 2019.]
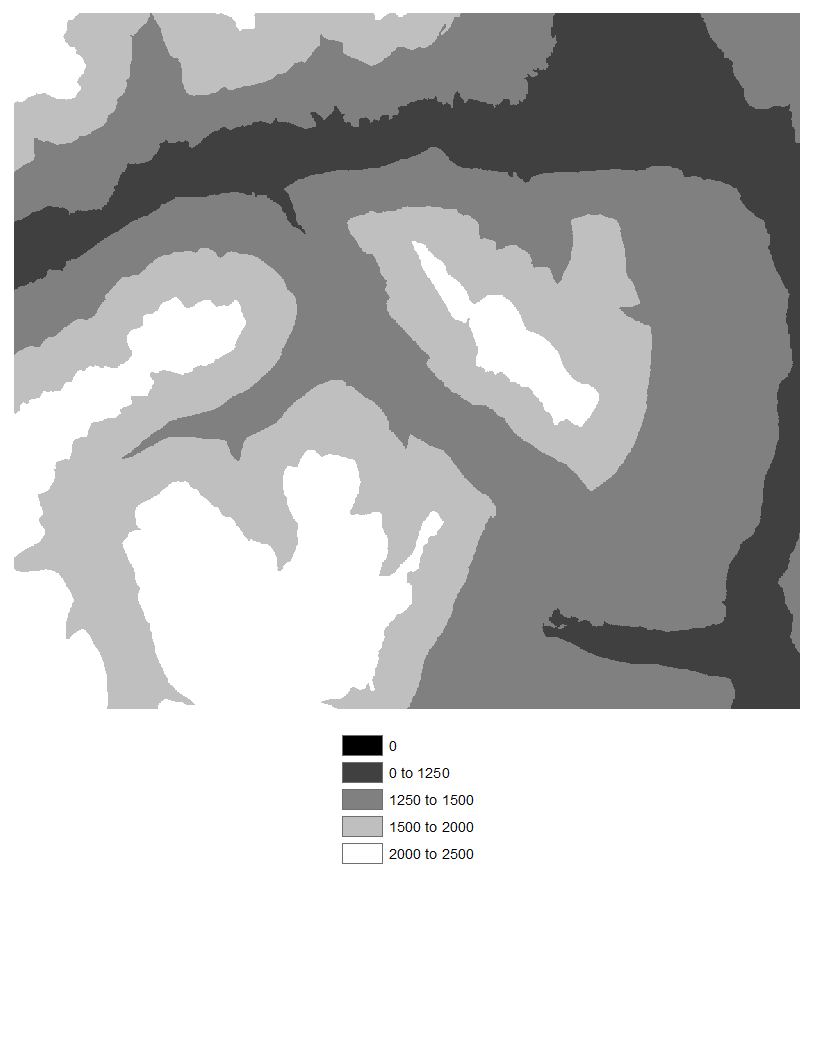
This DEM (with elevational values in metres) has been classified into five categories for simplification.[Canfor, 2019.]
– Leeza Perehudoff
References:
City of Vancouver. 2013. LiDAR 2013 – open data [Internet]. Vancouver (BC). Available from: https://data.vancouver.ca/datacatalogue/LiDAR2013.htm.
National Ecological Observatory Network (NEON). 2014. How does LiDAR remote sensing work – light detection and ranging [Internet]. Youtube. Available from: https://www.youtube.com/watch?v=EYbhNSUnIdU.
2 Comments
I have read so many articles or reviews regarding the blogger lovers
however this post is genuinely a pleasant article, keep it up.
Hi Leeza
Looking forward to your next installment!
CB